Chabot College Student Satisfaction
Survey: Fall 2003
Highlights
Student
engagement in learning and learning experiences at Chabot
| In the Fall 2003 Student Satisfaction Survey, students were asked how often they had initiated various | ||||||||||||
| learning activities, which types of teaching methods best helped them learn, and which methods they had | ||||||||||||
| experienced the most at Chabot. Only a few students had never spoken in class or been in a small class discussion | ||||||||||||
| group, but 30-40 percent of students had never been in a study group or met their instructor outside of class. The | ||||||||||||
| teaching methods that students said most helped them learn were not always what they experienced in their classes. | ||||||||||||
| The Fall 2003 Student Satisfaction Survey was conducted in October 2003 in a representative sample | ||||||||||||
| of sixty-nine course sections and was completed by 1,560 students (55% full-time and 45% part-time). | ||||||||||||
Student
engagement in learning
Averaging all your classes over all your semesters at Chabot, how often have you done the following activities?
| Often or | A little | Never | ||||||||||
| frequently | or some | |||||||||||
| In my classes I have: | • participated in small in-class discussion or projects | 46% | 48% | 6% | ||||||||
| • volunteered to speak | 27% | 59% | 13% | |||||||||
| • been called on by my instructor to speak | 27% | 61% | 13% | |||||||||
| Outside my classes I have: | • discussed class topics with other students in my classes | 33% | 54% | 13% | ||||||||
| • talked about class topics with people not in my classes | 27% | 54% | 19% | |||||||||
| • met as a study group with other students in my classes | 16% | 41% | 43% | |||||||||
| • met with instructors to discuss assignments or my progress | 15% | 55% | 30% | |||||||||
| • done work that was not assigned to improve my skills in classes | 15% | 50% | 36% | |||||||||
| • met with instructors to discuss course topics in a general way | 11% | 48% | 42% | |||||||||
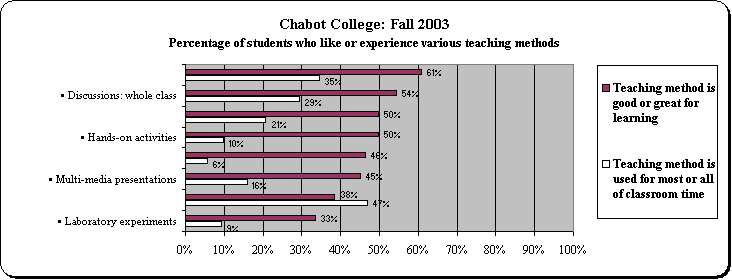
| Teaching methods that help students learn | ||||||||||||
| Percentage who have spent most or all of their Chabot classroom time in: | ||||||||||||
NOTE: All percentages have a margin of error of 3 to 5 percentage points.
