|
Chabot
College Student Satisfaction Survey: Fall 2005
Highlights
Changes in Student Satisfaction with Chabot |
|
|
|
|
|
|
|
|
|
|
|
|
|
|
|
|
|
|
|
|
|
|
|
|
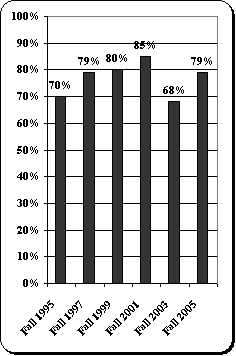
Student satisfaction with Chabot has
increased, according to the 2005 Student Satisfaction Survey. Compared
to two years ago, students appear more satisfied with
their overall experience of Chabot, with A&R staff, counselors,
and other college staff, and with the condition of facilities, including the
cafeteria and parking.
Some of the increases
may be due to fewer students choosing the middle category on the 5-point
satisfaction
scale. As the chart below shows,
overall satisfaction with Chabot was lowest in 1995 and 2003, when the middle
label was "neutral." This
year, with the use of the middle label of "neither satisfied nor
dissatisfied," overall
satisfaction returned to the 1997 and 1999 levels, although it was
not as high as in 2001.
In some cases, fewer students
choosing the middle category led to changes in the dissatisfaction rates as
well.
More students were
satisfied and fewer were dissatisfied with A&R staff and counselors this
year compared to 2003,
indicating a significant increase in satisfaction. However, in the case of the maintenance and cleanliness of the
buildings and grounds, satisfaction remained the same, while dissatisfaction
increased significantly. This could reflect
the loss of hourly maintenance staff in the last two years, who used to
clean restrooms during College Hour.
The Student Satisfaction
Survey was conducted in October 2005 in a representative sample of
seventy-five
course sections. Surveys were
completed by 1,605 students (62% full-time and 38% part-time). |
|
|
|
|
|
|
|
|
|
|
|
|
|
|
|
|
|
|
|
|
|
|
|
|
|
|
|
|
|
|
|
|
|
|
|
|
|
|
|
|
|
|
|
|
|
|
|
|
|
|
|
|
|
|
|
|
|
|
|
|
|
|
|
|
|
Overall
Satisfaction with Chabot |
|
|
|
|
|
|
|
|
|
|
|
|
|
|
|
|
|
|
|
|
Highest Increases in Overall
Satisfaction |
|
|
|
|
|
|
|
|
|
|
The most significant* increases in
satisfaction were in the following areas: |
|
|
|
|
|
|
|
|
|
|
|
|
|
|
|
Percentage of all students |
|
|
|
|
|
|
|
|
|
|
|
|
|
|
|
|
|
Satisfied or
very satisfied |
|
|
|
|
|
|
|
|
|
|
|
|
|
|
|
Fall 2003 |
|
Fall 2005 |
|
|
|
|
|
|
|
|
|
|
|
|
Overall
experience with: |
|
|
|
|
|
|
|
|
|
|
|
|
|
|
|
|
Chabot College |
|
68% |
|
79% |
|
|
|
|
|
|
|
|
|
|
|
|
Admissions and Records staff |
51% |
|
60% |
|
|
|
|
|
|
|
|
|
|
|
|
Other college staff |
|
51% |
|
59% |
|
|
|
|
|
|
|
|
|
|
|
|
Counselors |
|
|
42% |
|
52% |
|
|
|
|
|
|
|
|
|
|
|
|
Physical condition of: |
|
|
|
|
|
|
|
|
|
|
|
|
|
|
|
|
Computer labs in library and departments |
71% |
|
80% |
|
|
|
|
|
|
|
|
|
|
|
|
Learning Resource Center/Library |
67% |
|
77% |
|
|
|
|
|
|
|
|
|
|
|
|
Classroom (lecture) facilities |
56% |
|
65% |
|
|
|
|
|
|
|
|
|
|
|
|
Art/music/theatre/drama facilities |
55% |
|
66% |
|
|
|
|
|
|
|
|
|
|
|
|
Cafeteria |
|
|
54% |
|
62% |
|
|
|
|
|
|
|
|
|
|
|
|
Parking facilities |
|
29% |
|
37% |
|
|
|
|
|
|
|
|
|
|
|
|
|
|
|
|
|
|
|
|
|
|
|
|
|
|
|
|
|
|

|
|
|
|
|
|
|
|
|
|
|
|
|
|
|
|
|
|
|
|
|
|
|
|
|
|
|
|
|
|
|
|
|
|
|
|
|
|
|
|
|
|
|
|
|
|
|
|
|
|
|
|
|
|
|
|
|
|
|
|
|
|
|
|
|
|
|
|
|
|
|
|
|
|
|
|
|
|
|
|
|
|
|
|
|
|
|
|
|
|
Significant*
changes in satisfaction and/or dissatisfaction |
|
|
Satisfaction increased with A&R
staff and counselors, while dissatisfaction increased with the maintenance
and cleanliness of the campus. |
|
|
|
|
|
|
|
|
|
|
|
|
|
|
|
|
|
|
|
|
|
|
|
|
|
|
|
|
|
|
|
|
|
|
|
|
|
|
|
|
|
|
Overall experience with |
|
|
|
|
|
Maintenance/cleanliness |
|
|
|
|
|
|
|
|
|
A&R Staff |
|
|
Counselors |
|
|
|
of buildings
and grounds |
|
|
|
|
|
|
|
|
|
Fall 2003 |
Fall 2005 |
|
Fall 2003 |
|
Fall 2005 |
|
Fall 2003 |
|
Fall 2005 |
|
|
|
|
|
|
Satisfied or very satisfied |
51% |
60% |
|
42% |
|
52% |
|
57% |
|
57% |
|
|
|
|
|
|
Neither satisfied nor dissatisfied |
36% |
31% |
|
37% |
|
32% |
|
32% |
|
25% |
|
|
|
|
|
|
Dissatisfied or very dissatisfied |
13% |
9% |
|
21% |
|
16% |
|
11% |
|
18% |
|
|
|
|
|
|
|
|
|
|
|
|
|
|
|
|
|
|
|
|
|
|
|
|
*Note: These
differences in satisfaction and dissatisfaction are statistically significant
at the p<.05 level. |
|
|
|
|
|
|
|
|
|
|
|
|
|
|
|
|
|
|
|
|
|
|
|
|
|
|
|
|
|
|
|
|
|
|
|
|
|