A Profile of Middle Eastern Students at Chabot College |
![]() |
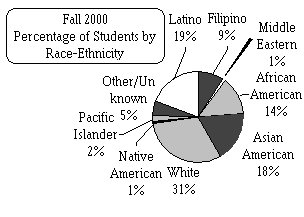
Middle Eastern students at Chabot | ||
Year | Number | Percent | |
1994 | 31 | < 1% | |
1995 | 65 | < 1% | |
1996 | 98 | 1% | |
1997 | 100 | 1% | |
1998 | 104 | 1% | |
2000 | 129 | 1% | |
NOTE: "Middle Eastern" was added as a separate ethnicity category in 1994, so the count was low at first. In addition, some Middle Eastern students identify as "White" or "Other", so the current count may also be low. |
Chabot College Fall 2000 | |||||
Middle Eastern students | All Chabot | Middle Eastern students | All Chabot | ||
Citizenship | 129 | 14,252 | Gender | 129 | 14,252 |
U.S. Citizen | 49% | 81% | Male | 53% | 44% |
Permanent resident | 47% | 18% | Female | 47% | 56% |
Student visas and other | 4% | 1% | 100% | 100% | |
100% | 100% | ||||
Age | Student Type | ||||
19 or younger | 40% | 23% | New (first time college) | 19% | 15% |
20-21 | 20% | 15% | New transfer | 15% | 13% |
22-24 | 12% | 13% | Returning transfer | 4% | 4% |
25-29 | 9% | 13% | Returning | 5% | 11% |
30-39 | 16% | 18% | Continuing | 53% | 55% |
40-49 | 3% | 11% | In high school | 3% | 2% |
50 or older | 1% | 8% | 100% | 100% | |
100% | 100% | ||||
New
students by type of high school district |
New
Mid. East.
students |
All
new students |
|||
Educational Goal | |||||
Transfer | 50% | 41% | |||
26 | 1,130 | AA/AS only | 7% | 10% | |
Chabot-LPC Districts | 58% | 48% | Certificate | 9% | 15% |
Other Alameda County | 12% | 17% | Personal Development | 3% | 8% |
Other CA Counties | 4% | 17% | Other/Undecided | 30% | 26% |
Other States | 4% | 5% | 100% | 100% | |
Other Countries | 23% | 12% | |||
100% | 100% |
Persistence Rates* of new and continuing students | |||||||
New Students | F94-S95 | F95-S96 | F96-S97 | F97-S98 | F98-S99 | F99-S00 | F00-S01 |
All students | 68% | 68% | 66% | 63% | 64% | 63% | 64% |
Mid. Eastern students | 56% | 82% | 74% | 57% | 77% | 77% | 60% |
Continuing Students | F94-S95 | F95-S96 | F96-S97 | F97-S98 | F98-S99 | F99-S00 | F00-S01 |
All students | 74% | 73% | 74% | 69% | 72% | 69% | 69% |
Mid. Eastern students | 0% | 74% | 80% | 65% | 67% | 70% | 78% |
SOURCES: Institutional Research Dataset, Fall 2000 Census file, Fall/Spring 2000-01 final files | |||||||
*Persistence rate: Percentage of students enrolled in Fall who also enrolled the following Spring |
Last Updated on 7/17/01
By research