Chabot-Las Positas Community College District
Percentage of Local High School Graduates Enrolled in Chabot College by High
School District and Year
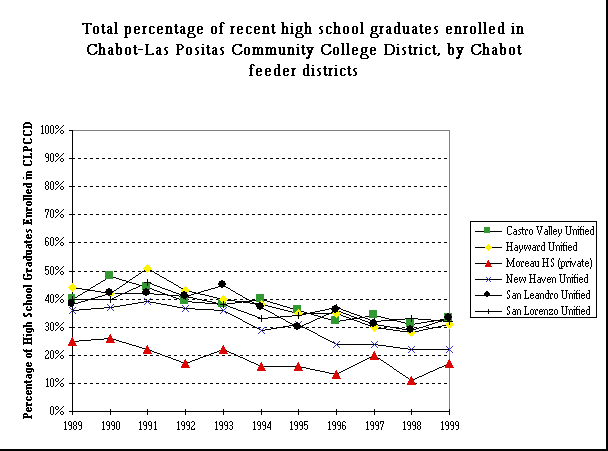
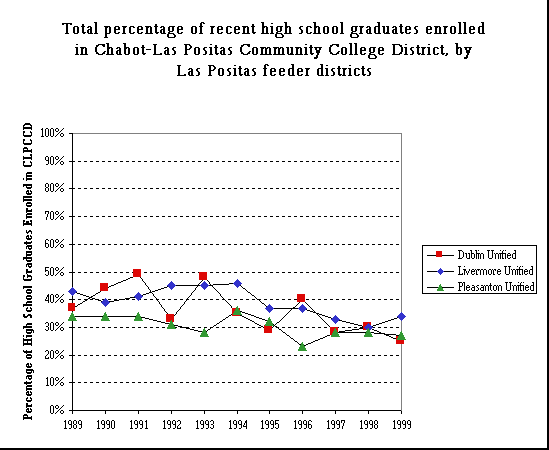
| Out of the nine high school districts in the Chabot-Las Positas Community College District, most have experienced a decline since 1991 in the percentage of their recent graduates who enrolled as new students in either Chabot or Las Positas Colleges. However, during these years, smaller percentages of the graduates from these high school districts attended any community college. High school districts whose percentages declined the most were Hayward and Dublin, although Dublin has fluctuated over the years. |
|
Chabot
feeder districts |
HS District | 1989 | 1990 | 1991 | 1992 | 1993 | 1994 | 1995 | 1996 | 1997 | 1998 | 1999 |
| Castro Valley Unified | 40% | 48% | 44% | 39% | 38% | 40% | 36% | 32% | 34% | 31% | 33% | |
| Hayward Unified | 44% | 42% | 51% | 43% | 40% | 38% | 35% | 35% | 30% | 28% | 31% | |
| Moreau HS (private) | 25% | 26% | 22% | 17% | 22% | 16% | 16% | 13% | 20% | 11% | 17% | |
| New Haven Unified | 36% | 37% | 39% | 37% | 36% | 29% | 31% | 24% | 24% | 22% | 22% | |
| San Leandro Unified | 38% | 42% | 42% | 41% | 45% | 37% | 30% | 36% | 31% | 29% | 33% | |
| Las
Positas feeder districts |
Dublin Unified | 37% | 44% | 49% | 33% | 48% | 35% | 29% | 40% | 28% | 30% | 25% |
| Livermore Unified | 43% | 39% | 41% | 45% | 45% | 46% | 37% | 37% | 33% | 30% | 34% | |
| Pleasanton Unified | 34% | 34% | 34% | 31% | 28% | 36% | 32% | 23% | 28% | 28% | 27% | |
| All HS Districts | 40% | 42% | 42% | 38% | 38% | 36% | 32% | 31% | 29% | 28% | 29% |


Updated by Andrew Revak
02/28/2001