| New students | ||||||||||||
|
Number of
course enrollments |
All Enrollments |
Gender | Race-ethnicity | |||||||||
| Female | Male | Asian American |
African American |
Filipino | Latino | Middle Eastern |
Native American |
Other | Pacific Islander |
White | ||
| 6,044 | 3,004 | 2,895 | 1,019 | 996 | 448 | 1,221 | 94 | 78 | 348 | 177 | 1,663 | |
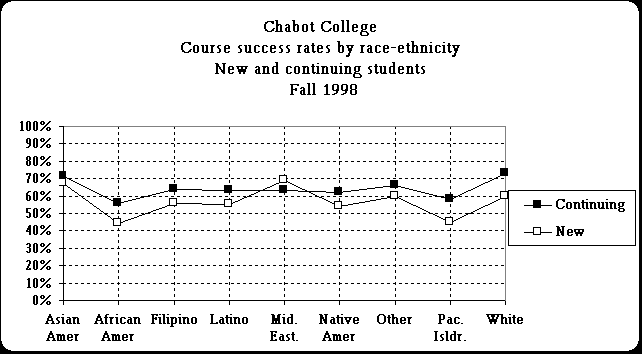
| Percent success | 57% | 58% | 56% | 67% | 44% | 56% | 55% | 69% | 54% | 60% | 45% | 60% |
| Percent non-success | 17% | 17% | 17% | 12% | 23% | 18% | 20% | 9% | 15% | 17% | 21% | 14% |
| Percent withdrawals | 26% | 25% | 26% | 21% | 33% | 27% | 25% | 22% | 31% | 23% | 33% | 25% |
| 100% | 100% | 100% | 100% | 100% | 100% | 100% | 100% | 100% | 100% | 100% | 100% | |
|
Continuing, returning,
and transfer students
|
||||||||||||
|
Number of
course enrollments |
All Enroll-ments |
Gender | Race-ethnicity | |||||||||
| Female | Male | Asian American |
African American |
Filipino | Latino | Middle Eastern |
Native American |
Other | Pacific Islander |
White | ||
| 36,681 | 16,818 | 13,278 | 5,759 | 4,425 | 2,882 | 5,619 | 229 | 319 | 1,247 | 616 | 9,541 | |
| Percent success | 65% | 67% | 66% | 71% | 56% | 64% | 63% | 63% | 62% | 66% | 58% | 73% |
| Percent non-success | 13% | 12% | 12% | 11% | 16% | 14% | 15% | 13% | 17% | 12% | 15% | 9% |
| Percent withdrawals | 22% | 20% | 22% | 18% | 28% | 22% | 22% | 24% | 21% | 22% | 27% | 18% |
| 100% | 100% | 100% | 100% | 100% | 100% | 100% | 100% | 100% | 100% | 100% | 100% | |
